How to Map Drill Results for a Junior Mining News Release
For a news-release drill map, plot collars from a CSV or GeoJSON, label the holes, badge the headline intercepts (grade × width), add the target and claim boundaries for context, keep the legend and title block clean, and export a PNG for the release and website or a news-release figure PDF. The map should be legible at the small size it appears in an email or on a phone.
Why the map carries the news release
In a junior mining news release, the drill map is often the first thing readers look at — before the body text. A clear map showing where the holes are and which intercepts matter helps the result land with investors who skim. A confusing map buries the news.
What you need
- Drill collar locations (hole ID + decimal-degree coordinates) as CSV or GeoJSON
- The headline intercepts you'll highlight (grade × width)
- The target outline and your claim boundaries for context
- Your logo, the date, and the project name
Step 1: Plot the drill collars
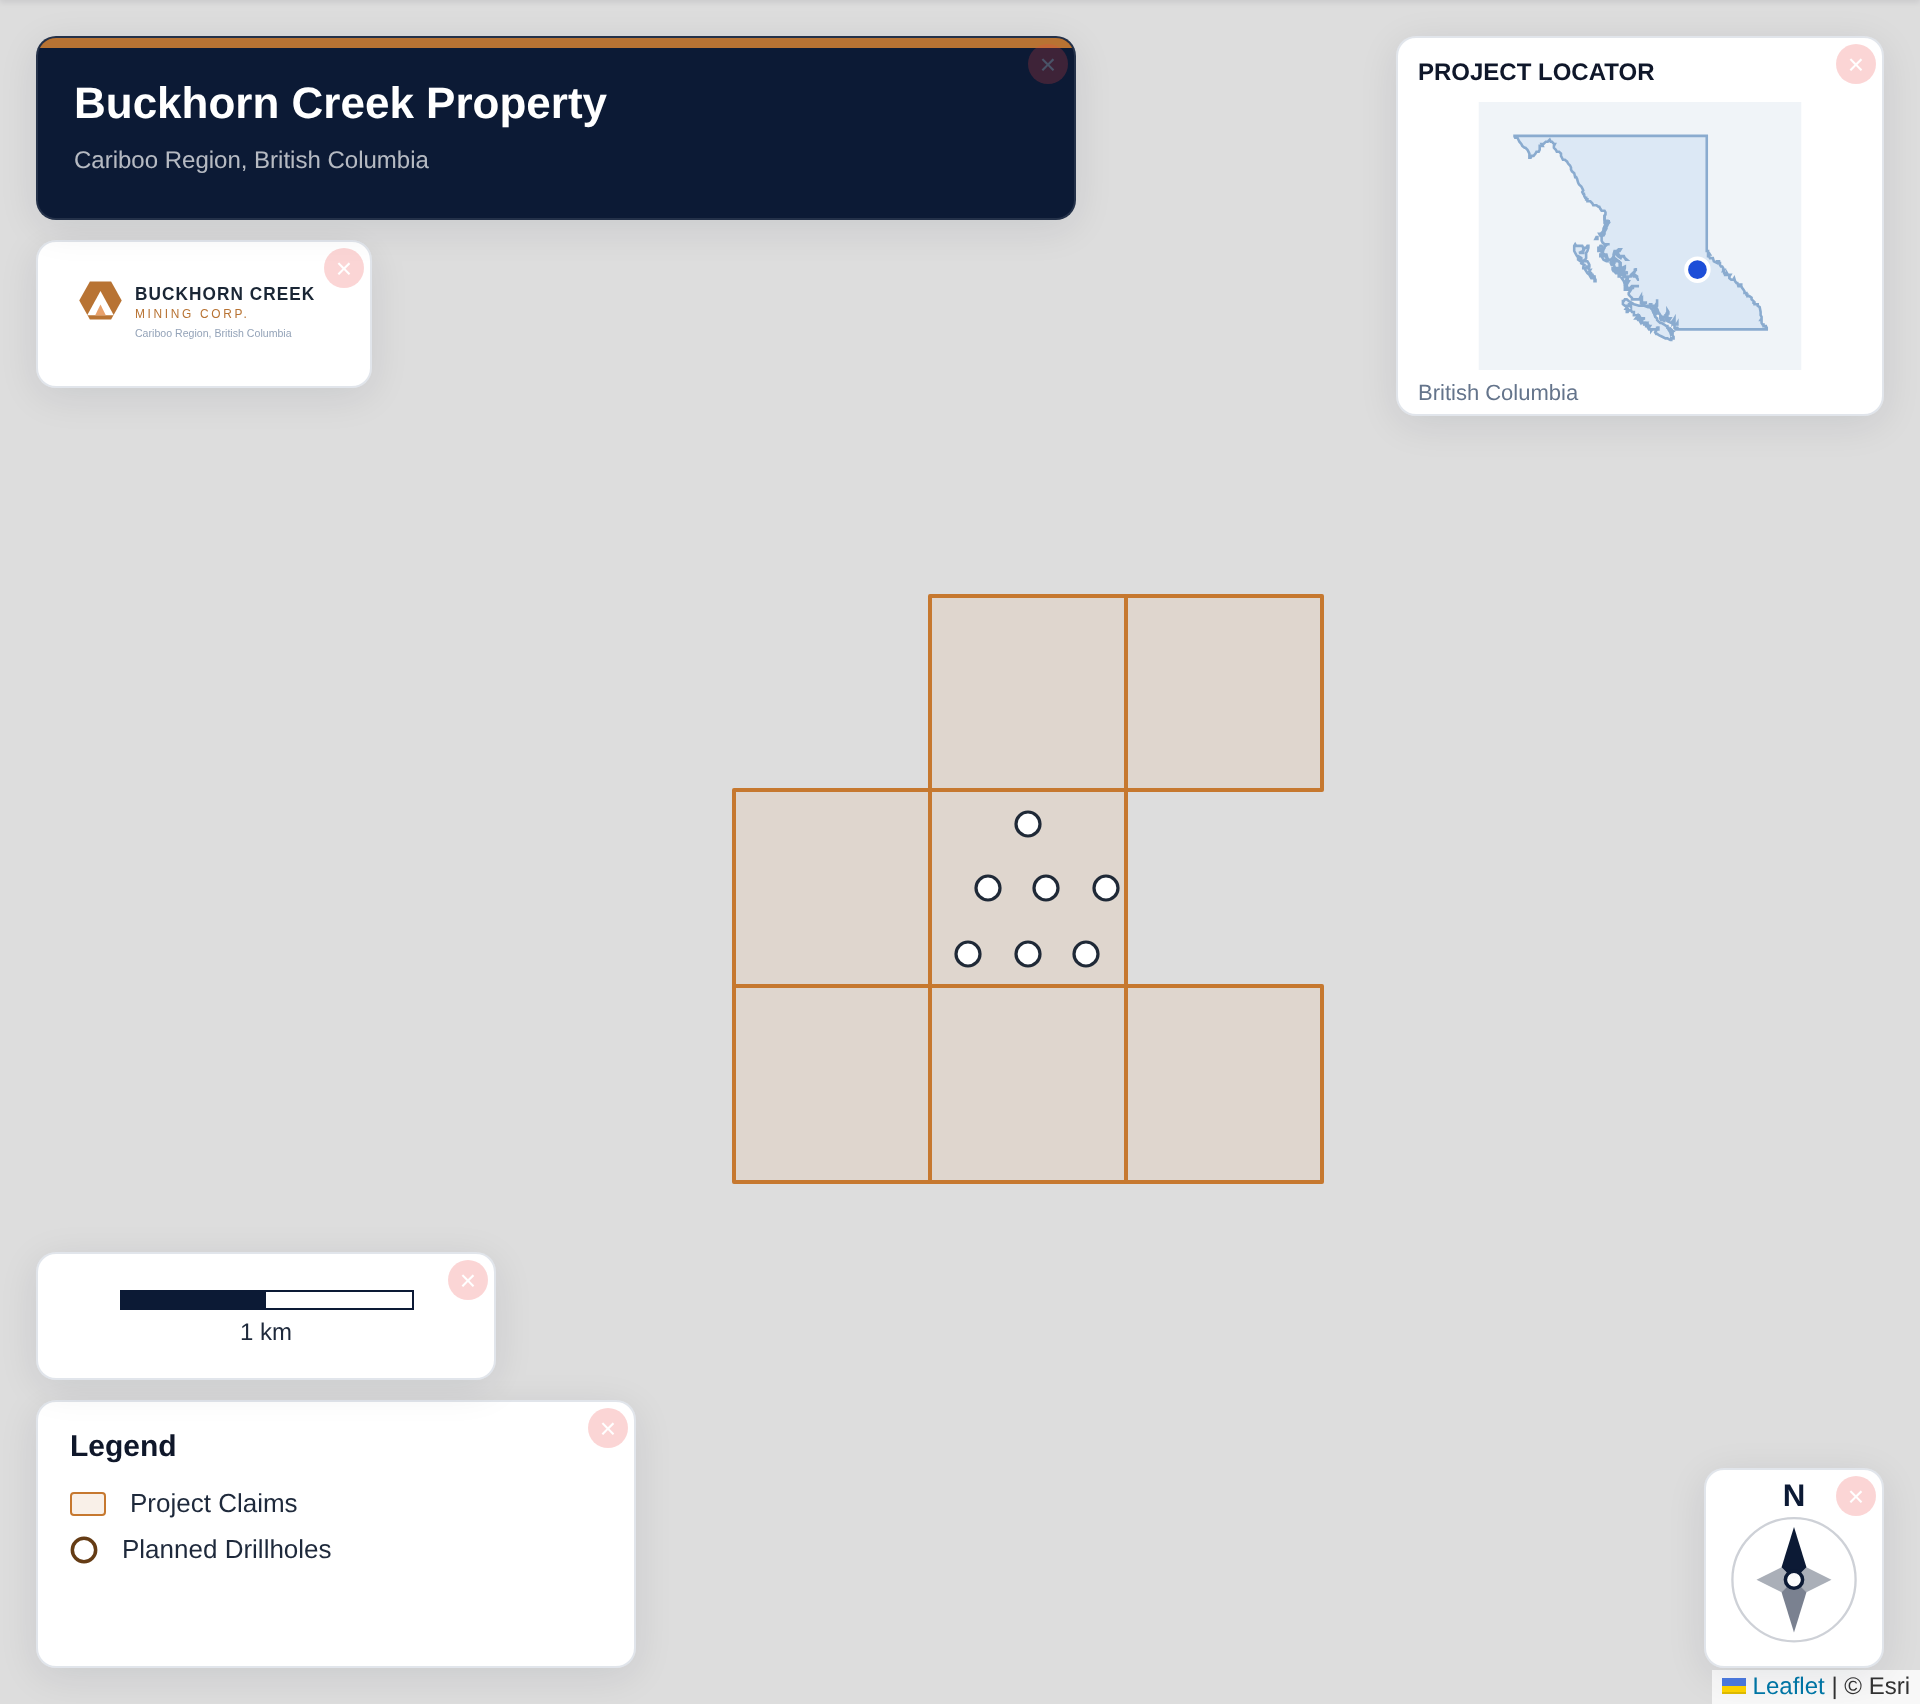
Import collars from a CSV or GeoJSON — typically hole ID, latitude, longitude — and assign the Drillholes role. Keep the symbols consistent so the drilling pattern is easy to follow. See the CSV import guide if your coordinates need attention.
Step 2: Highlight the headline intercepts
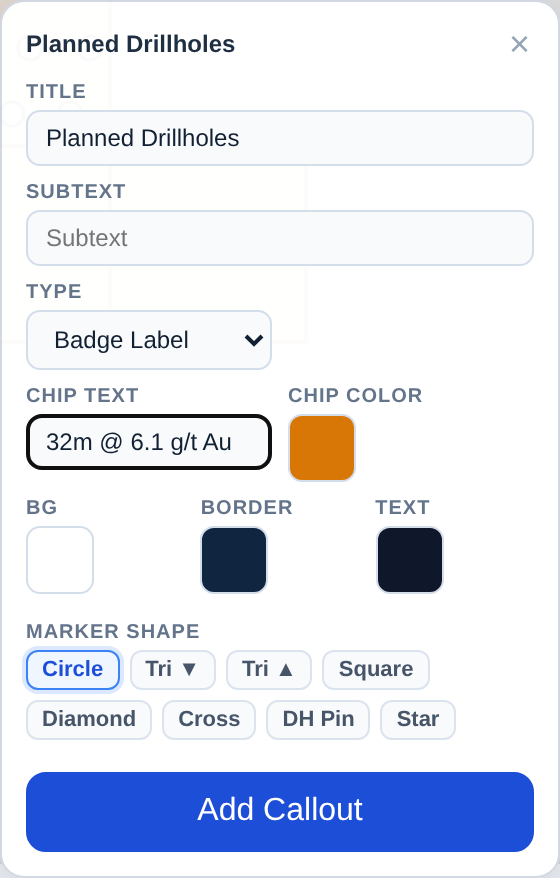
Add Badge Label callouts next to the holes that drive the story — grade over width, e.g. '32m @ 6.1 g/t Au'. Resist labelling every hole; spotlight the results investors should remember so attention goes where it should.
Step 3: Show the target and claim context
Add the target outline and your claim boundaries so readers can see the holes are testing the intended target and sit on the company's ground. Context is what turns a set of dots into an interpretable result.
Step 4: Keep it clean for a wide audience
News releases reach non-technical readers. Use a clear basemap, a concise legend, a readable title block with your logo, and a scale bar and north arrow. Check it's legible at the size it will appear in an email or on a phone.
Step 5: Export the figure
Export a PNG sized for email and web, or a news-release figure PDF if the map is also a report attachment. Reuse the same figure in your investor deck so the story stays visually consistent across the release, the website, and the presentation.
Example: a discovery-hole release
Your release leads with one discovery hole and two strong step-outs. Plot all collars, badge the three headline holes with grade × width, outline the target and your claim, switch to Satellite to show the setting, add a clean title block with the date, and export a PNG plus a figure PDF — ready for the wire, the website, and the deck.
Disclosure and verification
Related guides
Build the underlying map with the drill results map guide, fix coordinate issues with the CSV import guide, reuse the figure with the investor presentation guide, and export with the PDF export guide. The full feature set is on the drill results map tool page.