Drill Results Map — Ontario
Ontario — hosting the prolific Abitibi Greenstone Belt and Canada's largest gold output — is a prime target for junior exploration companies. Here's how to create a professional drill results map using Exploration Maps in 15–30 minutes.
About Mining in Ontario
Ontario is the largest gold producer in Canada and hosts the prolific Abitibi Greenstone Belt, one of the most mineralized geological terranes on Earth.
Key minerals: gold, nickel, copper, zinc, silver, platinum group elements. Notable deposits: Detour Lake, Macassa, Timmins Gold Camp, Sudbury Basin. Mining districts: Timmins-Porcupine, Kirkland Lake, Red Lake, Abitibi Greenstone Belt.
The Ontario Ministry of Mines administers mineral rights in Ontario. Claim data is accessible through Ontario Mineral Lands Administration System (MLAS).
Getting Mining Data for Ontario
| Portal | Formats | Notes |
|---|---|---|
| Ontario Mineral Lands Administration System (MLAS) | Shapefile, CSV, KML | MLAS exports use NAD83 UTM Zone 17N (EPSG:32617) for most of Ontario. Convert to WGS84 before importing, or verify your data's coordinate system when the imported layer appears offset from the basemap. |
How to Create a Drill Results Map for Ontario
For a full step-by-step guide to drill results maps, see How to Make a Drill Results Map.
- Import your drill collar CSV (columns: hole ID, latitude, longitude, depth, assay)
- Assign the Drillholes layer role
- Import the property claims boundary as GeoJSON
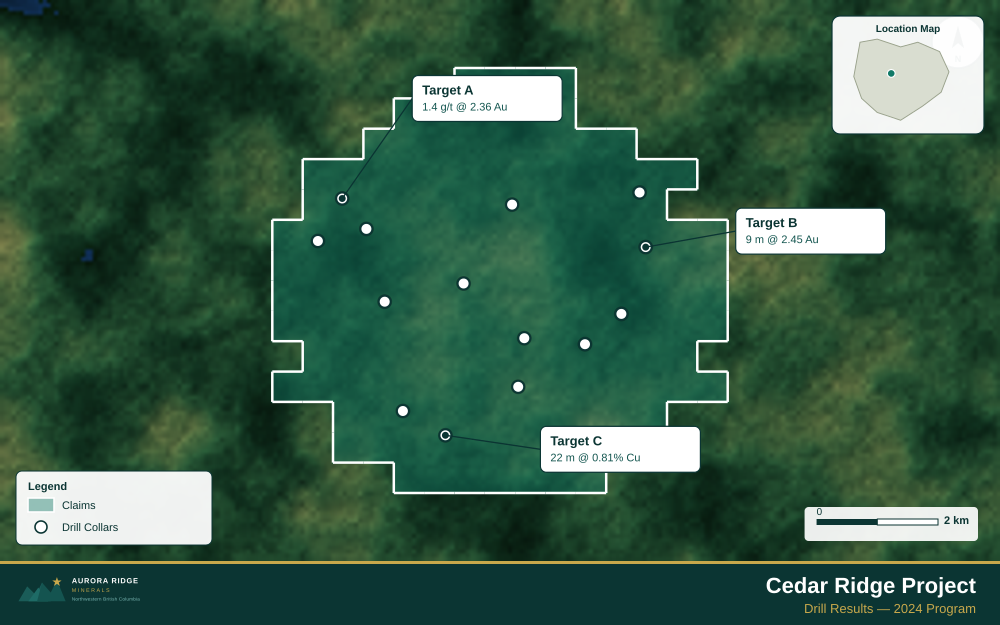
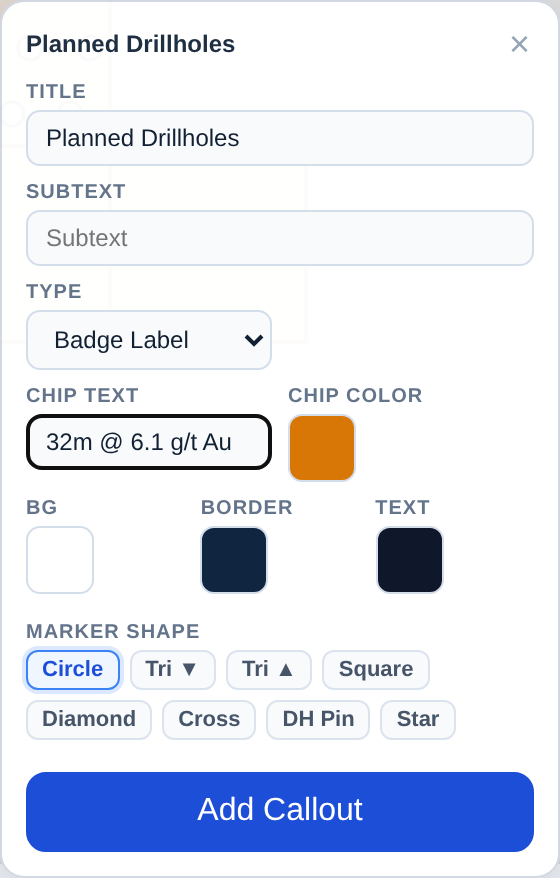
- Add callout labels to key holes showing hole ID and best intercept
- Use Badge Label type to highlight the highest-grade holes
- Configure the title with program name and date
- Set the Landscape 16:9 ratio for news release figures
- Export as PNG at 2× for email and PDF for the news release attachment
Tip for Ontario: The Abitibi Greenstone Belt straddles the Ontario–Quebec border — if your property spans both provinces, import the two provincial claim files as separate layers and keep them distinct for regulatory clarity.
Recommended Settings for Ontario
- Basemap: Light or Satellite
- Design theme: Investor — Navy & White
- Export format: PNG at 2× for investor presentations, PDF (Letter or A4) for NI 43-101 reports
- Coordinate system: Ensure source data is in WGS84 (EPSG:4326)
Common Use Cases in Ontario
- Exploration news releases
- NI 43-101 technical reports
- Investor day presentations
- Analyst briefings