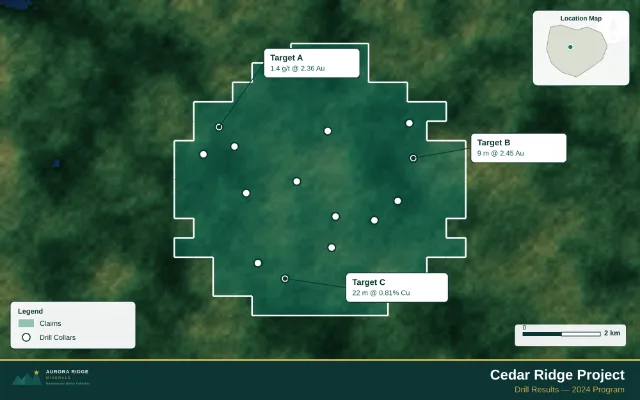
Turn a drill collar CSV into a map with hole locations, selected result labels and a property boundary. Use the downloadable 14-hole example to try the workflow, then import your own reviewed collar and assay data.
Start free. Free PNG exports keep a small Exploration Maps credit. Pro removes that credit for US$29/month or US$290/year.
Start with a complete example
Download the 14-collar CSV · Download its claim boundary · Sample notes and reuse
What your collar file needs
| Field | Purpose |
|---|---|
| HoleID | Identifies the collar and its label. |
| Longitude / Latitude | WGS84 decimal-degree location. |
| Result or other attributes | Optional text you can use in callouts; the app does not validate assay results. |
Build the map in four steps
The drill-results guide walks through coordinates, labels and export checks. Open the finished demonstration map to inspect the example layout.
- Upload the CSV and confirm any coordinate mapping prompt.
- Assign Drillholes and check the collar positions.
- Import the boundary; label the results that need explanation.
- Choose a layout, save the project and check the exported figure at publication size.
Use the map to explain the program
Keep the collar pattern visible, use a small number of readable labels, and include the program date and source. An imported boundary provides spatial context; it does not certify title ownership. The issuer and its reviewers remain responsible for the information published.
Return for the next update
Save to an account if you want to reopen the project later. When new collars arrive, add the reviewed data, check labels and dates, and export the revised map.
See data coverage and methodology for how uploaded and demonstration data are handled.
Make your first map
Upload your collar CSV, check the locations, add result labels, and export your drill map.
Upload my data →