How to Create an Infrastructure Map for a Mining Property
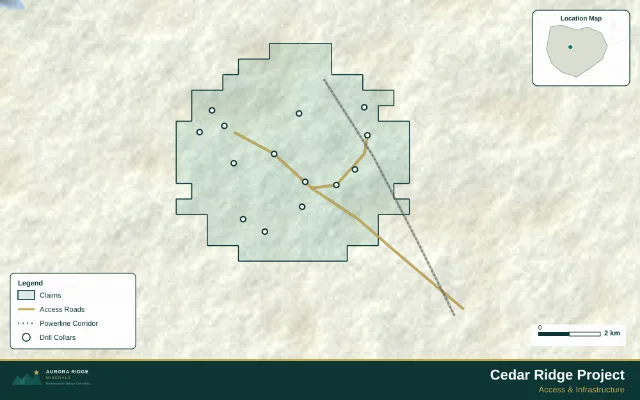
To make an infrastructure map, import your property boundary, add roads, powerlines, rail, and facilities as line and point layers, style them in muted colours under a Topographic or Satellite basemap, add distance rings to key infrastructure, and export. The story is access and cost — make distances explicit.
Turn public claim data into a clean map.
No GIS experience needed — import, style, and export in minutes.
Create my map →
What you need
- Property/claims boundary
- Infrastructure line data — roads, powerlines, rail (government open-data portals publish these for most jurisdictions)
- Point locations for facilities: towns, ports, mills, airstrips, camps
- The distances that matter to your story (to power, to port, to labour)
Build the map
- Import the property boundary (Claims role)
- Import each infrastructure type as its own layer — separate layers mean separate legend entries and independent styling
- Style lines by type: solid for existing roads, dashed for proposed routes; distinct colours for power vs rail
- Add facility points with labels (port, mill, town names)
- Choose the Topographic basemap — terrain context explains why routes go where they go
- Add distance rings from key infrastructure (e.g. '35 km from grid power')
- Title block, legend, scale bar, north arrow — then export
Layer sources and styling
| Feature | Typical source | Style |
|---|---|---|
| Roads | Provincial/state open-data road network | Solid line, neutral grey/brown |
| Powerlines | Utility or government GIS portals | Distinct colour (e.g. orange), medium weight |
| Rail | National rail network datasets | Dark solid line |
| Proposed routes | Your engineering sketch | Dashed — never solid |
| Facilities | Manually placed points | Labelled markers, kept sparse |
Make distance the headline
Numbers beat lines
Investors don't measure your map — they read it. A road on the map says access exists; a distance ring labelled '12 km to Highway 37' says what it costs. Put explicit distances on every piece of infrastructure that matters.
Map your project's access story.
Import boundaries and infrastructure, label the distances, export.
Create my map →
Import your file and export an investor-ready map.
Open the editor and have a shareable map in minutes.
Create my map →
Frequently Asked Questions
Where do I get roads and powerline data?
Provincial and state open-data portals publish road networks and, in most cases, transmission lines as downloadable GIS layers (Shapefile or GeoJSON). National datasets cover rail. Convert to GeoJSON at mapshaper.org if needed and import each as its own layer.
How do I show proposed vs existing infrastructure?
The universal convention: existing = solid lines, proposed = dashed. Add '(proposed)' to the legend label too — a study reviewer will look for it.
What basemap works best for infrastructure maps?
Topographic. Contours explain route choices (valleys, passes) and give field-realistic context. Satellite is the alternative when vegetation/terrain imagery itself is part of the access story.
Should an infrastructure map show my drill targets too?
Usually not — one map, one story. Keep the infrastructure figure clean and pair it with a separate targets or results map in the same deck, using the same basemap and theme for consistency.
Can I use this for a PEA or feasibility-style figure?
Yes — a clean property-plus-infrastructure figure with explicit distances is a standard early-study exhibit. Export as Letter PDF at 3× pixel ratio for the document, and have the study author confirm figure requirements.