How to Make a Mining Claims Map
To make a mining claims map, get your claims into Exploration Maps — either search a claimholder to pull public registry data or import a GeoJSON, Shapefile, or KML — assign the Claims layer role for standard blue styling, add context layers and a title block, then export as PNG or PDF. Exploration Maps is a visualization tool, not the official registry, so verify ownership and boundaries with the relevant provincial registry.
What you need before you start
A mining claims map needs claim geometry plus a little context. Gather:
- Claim data: a claimholder name to search, or a boundary file (GeoJSON, Shapefile, or KML)
- Optional context: roads, water, or infrastructure files
- Your company logo (PNG or JPG)
- Project name, map date, and any required disclaimers
Find your province's claim-search guide first
The fastest way to map claims is to search a claimholder and pull public registry data straight into the map. Each province's registry works a little differently — start with the guide for your jurisdiction, then come back here to style and export.
Province guides: British Columbia · Ontario · Quebec · Newfoundland & Labrador · Saskatchewan · Manitoba · Yukon.
Step 1: Get your claims onto the map
Open Exploration Maps. To search public data, choose Add Claims → Search Claims Registry, pick your province, and type a company or claimholder name. To use your own file, click the import button in the Layers section and select your GeoJSON, Shapefile, or KML. Either way the layer is added automatically and the map fits to your claims. If your data is corner coordinates in a spreadsheet, import the CSV and the Column Mapper assigns the fields.
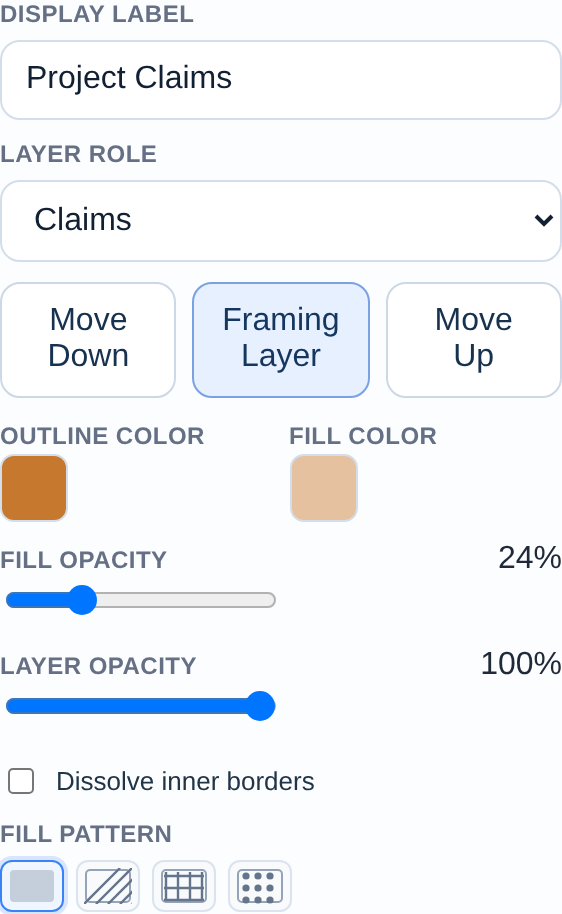
Step 2: Assign the Claims layer role
Expand the layer card and select 'Claims' from the Role dropdown. This applies the standard convention automatically: a blue stroke with a light, semi-transparent blue fill — the styling investors and NI 43-101 reviewers expect. Override the stroke and fill colours per layer if you're showing multiple blocks.
Step 3: Add context layers
A claims map without context is hard to read. Enable the Context overlay (roads, towns, water) and Reference Labels in the Design section, and reduce overlay opacity to 40–60% so your claims stay dominant. Add roads or infrastructure files if you have them.
Step 4: Choose a basemap and theme
For investor presentations and reports, the Light basemap with the Investor — Navy & White theme is the standard choice. Use the Satellite basemap to show terrain, and the Technical — Sharp Borders theme for formal regulatory filings.
Step 5: Configure the title block and logo
Click the title on the map to edit it inline — project name as the title, company name as the subtitle. Add the map date and project number in Design → Text & Metadata, and upload your logo at the bottom of the Layers section.
Step 6: Export your map
Activate an export ratio — Landscape 16:9 for slides and news releases, Letter Portrait for technical reports — frame your claims within the bounds, then export PNG for presentations or PDF for print. Enter your email to unlock watermark-free exports.
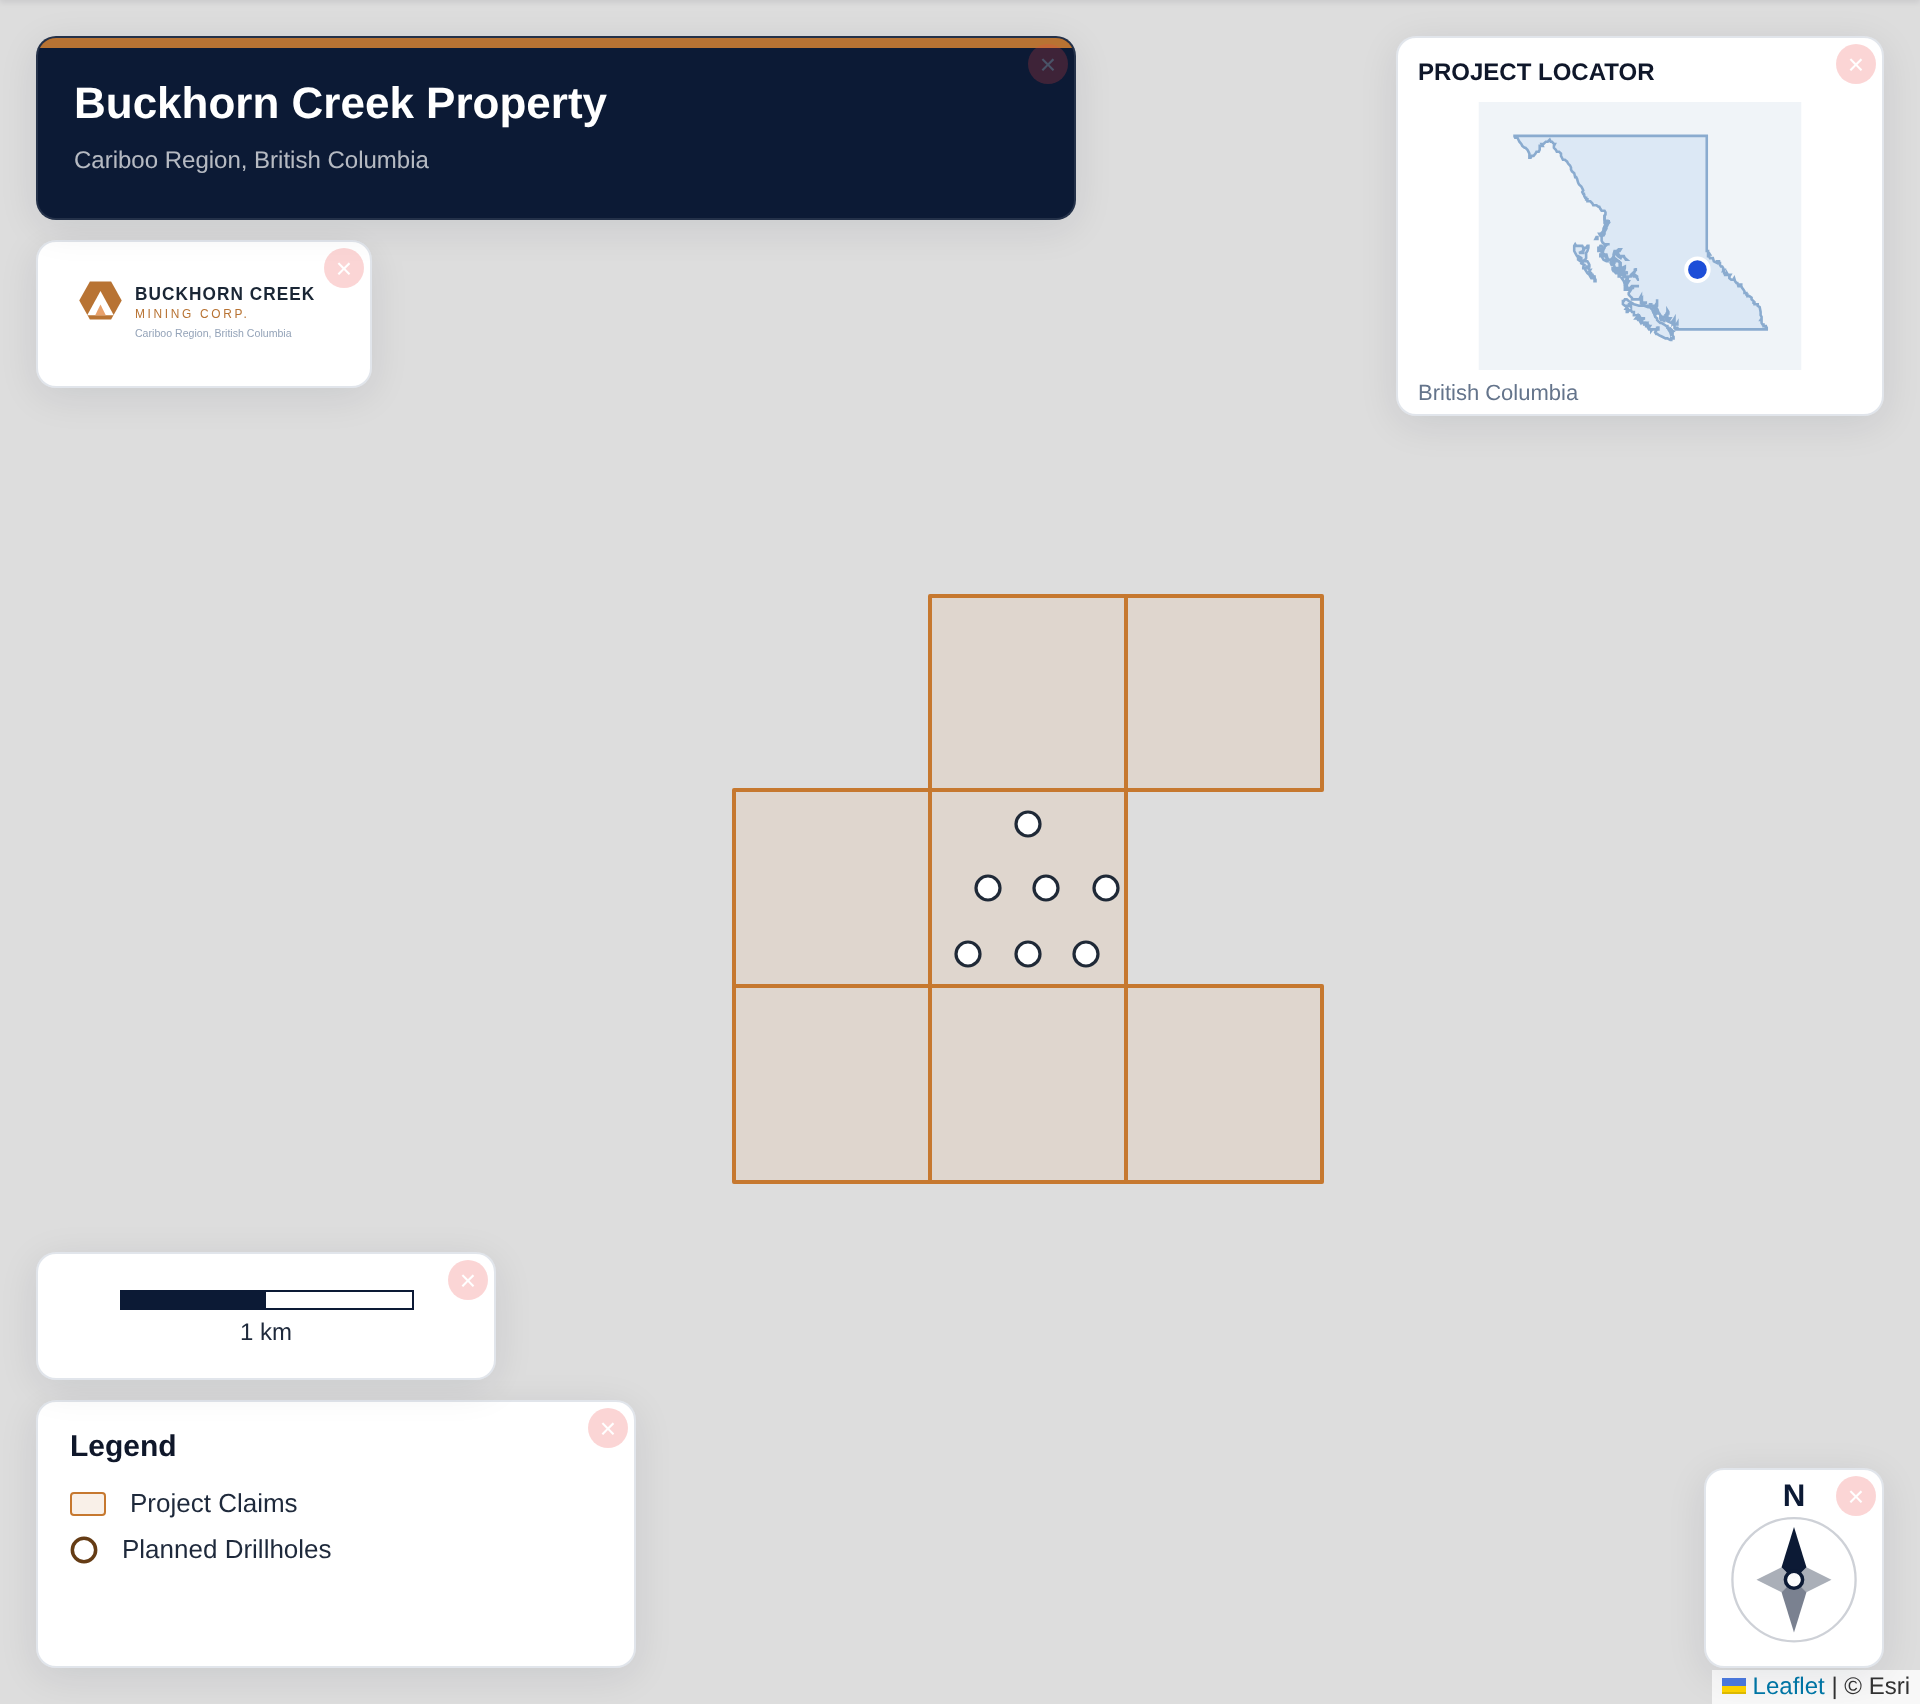
Example: a two-block property overview
Suppose you hold a core claim block and recently optioned a second block. Import (or search) both, put each on its own layer, colour the core block solid blue and the optioned block in a contrasting outline, rename the layers 'Core Claims' and 'Optioned Ground', add roads for access context, drop in your logo and date, and export Landscape 16:9. You now have a clean property overview suitable for a deck or a news release.
Choosing your starting point
| You have… | Best path | Guide |
|---|---|---|
| Just a company name | Search the claims registry in-app | Your province guide above |
| A Shapefile or GeoJSON | Import as a layer | Import GeoJSON / Shapefile |
| A KML from Google Earth | Import as a layer | Import GeoJSON / Shapefile |
| Corner coordinates in a spreadsheet | Import CSV + Column Mapper | Import CSV data |
| Drill collars to add | Import collar CSV, assign Drillholes | Drill results map |
Where the data comes from
Verify before you rely on the map
Related guides
Build investor visuals with the investor presentation guide, add drill data with the drill results map guide, learn imports in the GeoJSON / Shapefile guide, and finish with the export to PDF guide.