How to Import CSV Data into a Mining Map
To import CSV data into a mining map, click import and select your CSV — the Column Mapper opens automatically. Assign your latitude and longitude columns (in decimal degrees), click Import, and your points render immediately. Every other column is preserved as a feature property you can use for labels and callouts.
What CSV data works with Exploration Maps
Any CSV with a coordinate pair works. The most common exploration uses are:
- Drill collars: Hole ID, Latitude, Longitude, Total Depth, Best Intercept
- Soil geochemistry: Sample ID, Latitude, Longitude, Au (ppb), As (ppm)
- Rock samples: Sample ID, Latitude, Longitude, Rock Type, Grade
- Prospects / showings: Name, Latitude, Longitude, Type, Notes
- Historical workings: Name, Latitude, Longitude, Type (shaft, adit, open cut)
Required and recommended columns
Only the coordinate pair is strictly required. Column names can be anything — you assign them in the Column Mapper.
| Column | Required? | Example | Notes |
|---|---|---|---|
| Latitude | Required | 49.2827 | Decimal degrees (WGS84) |
| Longitude | Required | -123.1207 | Decimal degrees; negative in the west |
| ID / Name | Recommended | DDH-24-012 | Becomes the point label |
| Value column(s) | Optional | 4.8 (g/t Au) | Grade, depth, element — kept as properties |
| Type / Category | Optional | Soil | Useful for styling or splitting layers |
Step 1: Prepare your CSV
Use decimal degrees (e.g. 49.2827, -123.1207). The first row must be headers, with no blank rows above it, and any text fields containing commas should be wrapped in double quotes. If your data is in UTM (easting/northing), convert it to decimal degrees first — see the coordinate-issues section below.
Step 2: Import and open the Column Mapper
Click the import button in the Layers section and select your CSV. The Column Mapper opens automatically, listing every detected column with dropdowns to assign roles.
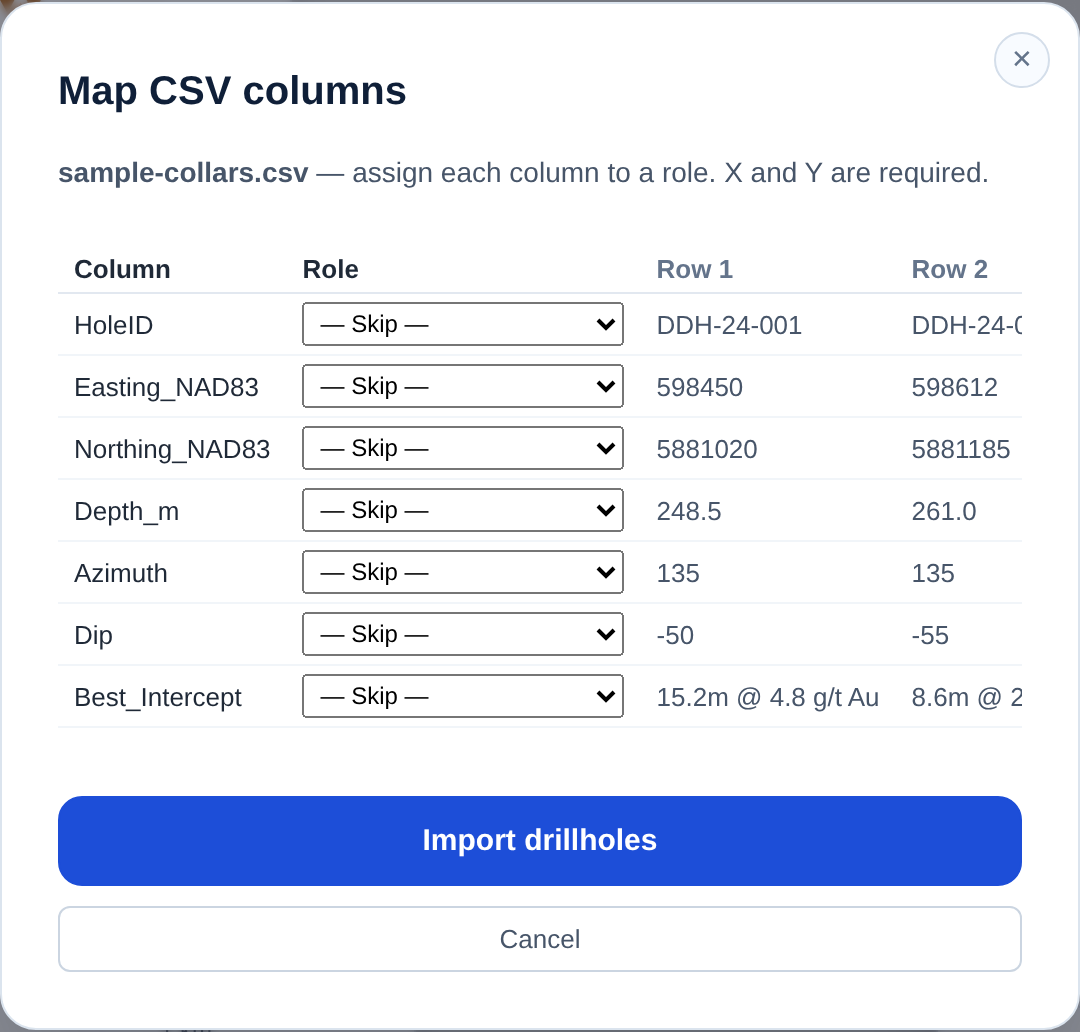
Step 3: Assign latitude and longitude
Use the Latitude and Longitude dropdowns. Columns named Lat, Latitude, Y, or POINT_Y (and Long, Longitude, X, POINT_X) are auto-detected; assign anything else manually. Click Import and your points render on the map immediately.
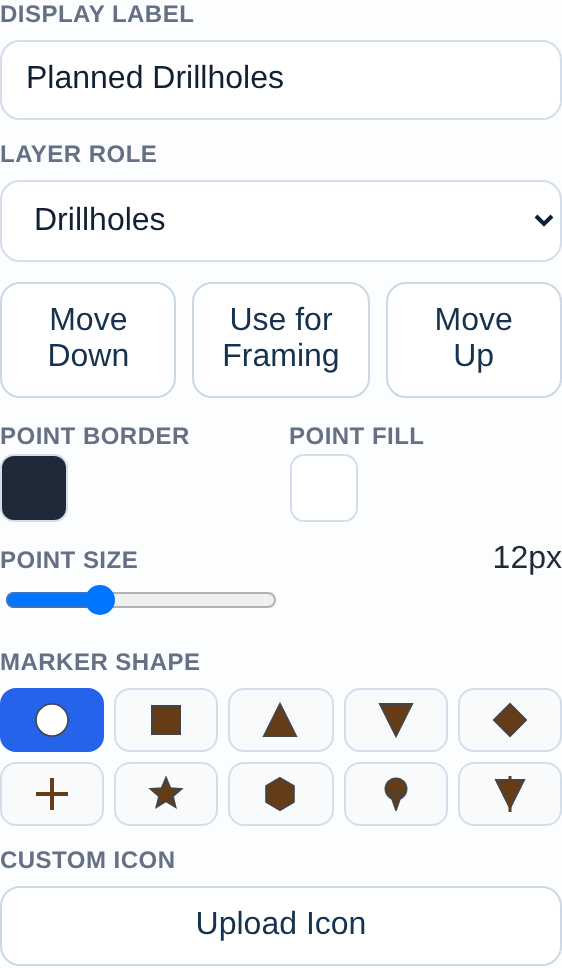
Step 4: Set the role and style
Expand the layer and assign a role: Drillholes for collars, Anomalies for geochem, or Default for general points. Override marker colour, size, and shape in the styling controls. For soil results, sizing markers by grade communicates spatial distribution at a glance.
Step 5: Label points and add callouts
Click any point to open the inline feature editor — all your CSV columns are available as properties. Put the hole or sample ID in the label, and for drill holes put the best intercept in the subtext (e.g. '15.2m @ 4.8 g/t Au'). For headline results, use a Badge Label so the number stands out.
Common coordinate issues and fixes
Most failed imports are coordinate problems, not file problems.
- UTM instead of decimal degrees: easting/northing in the hundreds of thousands won't plot — convert to decimal degrees (WGS84) first in QGIS or an online converter
- Lat/long swapped: points land in the wrong hemisphere — re-map the columns
- Sign dropped: western longitudes (and southern latitudes) must be negative — -123.1, not 123.1
- Degrees-minutes-seconds: convert to decimal degrees (DD = D + M/60 + S/3600)
- Commas inside a field: wrap text values containing commas in double quotes so columns don't shift
- Blank rows above the header: delete them so the first row is the header
Example: mapping a soil grid
You have a 400-sample soil grid as a CSV with Sample ID, Lat, Long, and Au (ppb). Import it, map the coordinates, assign the Anomalies role, size the markers by the Au column so anomalies read instantly, label your top samples, add the claims boundary for context, and export Landscape 16:9. A spreadsheet becomes a presentation-ready anomaly map in a few minutes.
What the app does with your data
Cannot: reproject from a local grid or UTM for you (convert to decimal degrees first), or validate the underlying assays/QA-QC. The map reflects exactly the data you import.
Related guides
Use this with the drill results map guide and the mining claims map guide, or import vector files with the GeoJSON / Shapefile guide. Finish with the export to PDF guide.