How to Choose the Right Basemap for a Mining Map
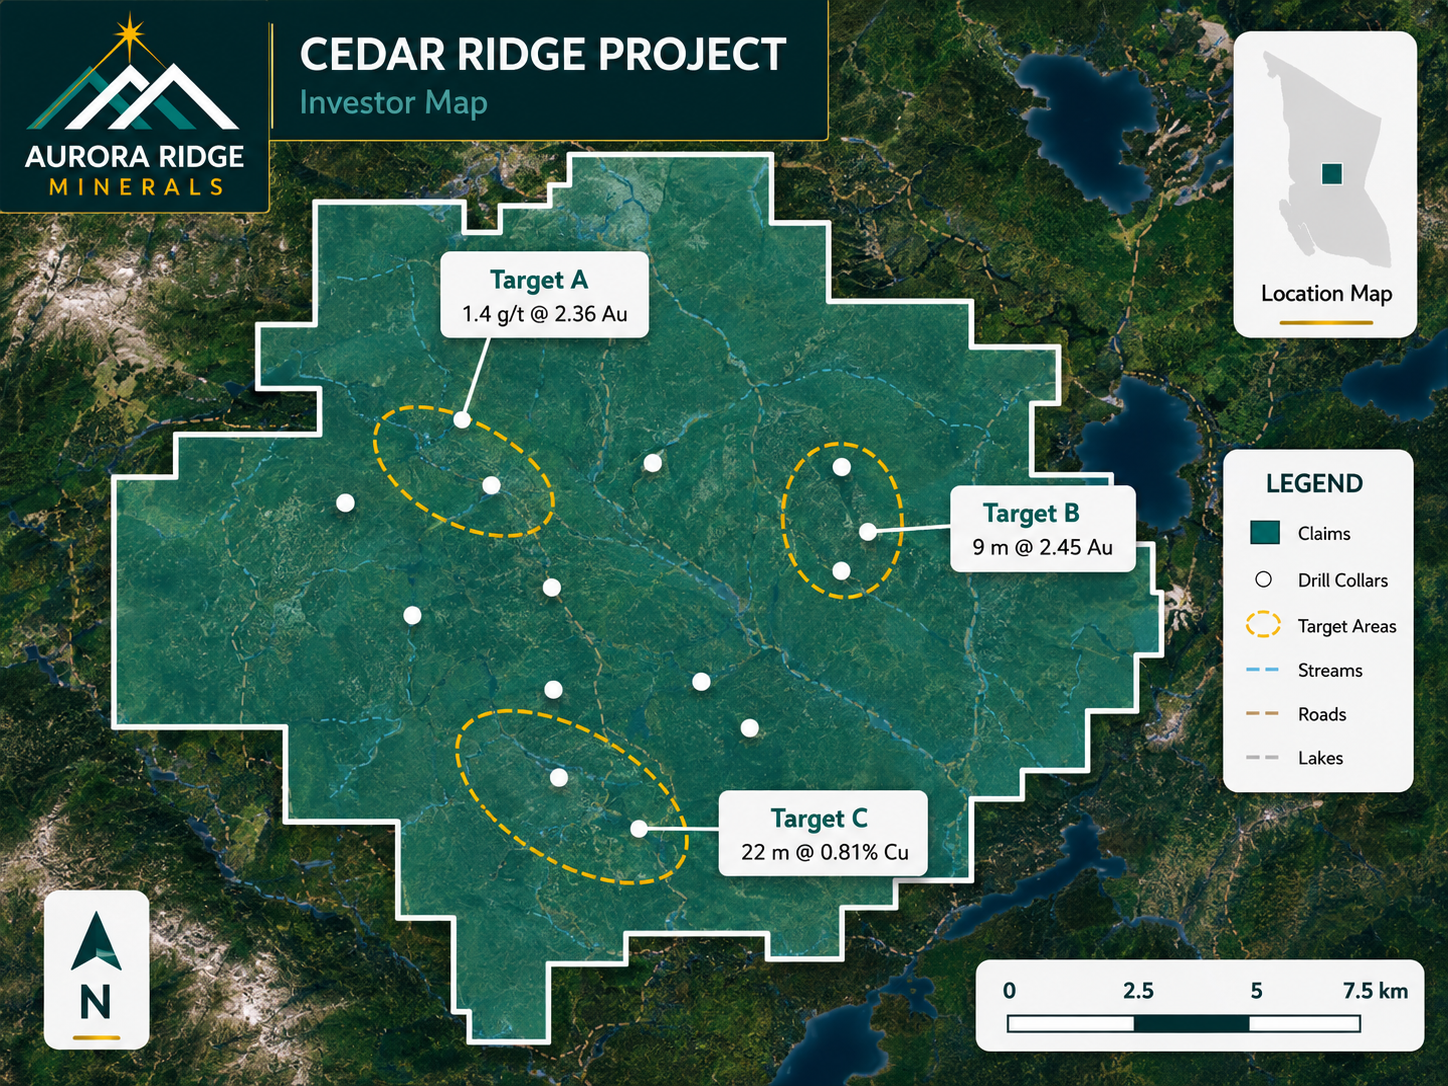
Use the Light basemap for NI 43-101 reports and regulatory filings, Satellite for investor presentations that benefit from terrain context, Topographic for access and infrastructure maps, and Dark for digital dashboards and social media. When in doubt: Light for print, Satellite for slides.
Quick reference
| Basemap | Best for | Avoid when |
|---|---|---|
| Light | NI 43-101 figures, permitting, any printed document | You need terrain or vegetation context |
| Satellite | Investor decks, location maps, showing access and topography | The document will be printed in black and white |
| Topographic | Access roads, infrastructure planning, field maps | The audience is non-technical investors |
| Dark | Websites, social posts, on-screen dashboards | Print of any kind — dark backgrounds waste ink and lose detail |
Light — technical reports and regulatory filings
A neutral light-grey canvas that makes data layers the star: claim boundaries, drill collars, and labels all read clearly, and it photocopies and prints without losing information. If the map is going into a technical report, a permit application, or anything a regulator will read, start here.
Satellite — investor presentations and location maps
Real imagery gives an audience instant context — terrain, vegetation, lakes, existing roads and disturbance. It answers the questions investors actually ask ('how remote is this?', 'is there access?') before they're asked. Pair it with white or light-coloured boundaries and labels so they hold contrast against the imagery.
Topographic — access and infrastructure maps
Contour lines and elevation shading make this the right choice when the story is physical: road access, proposed drill pads, powerline routes, camp locations. Field crews also find topo maps the easiest to orient with.
Dark — digital-first content
High contrast makes coloured layers glow on screen — striking for a website hero, a social post announcing results, or an on-screen dashboard. Never print it.
Add context to any basemap
Whichever basemap you pick, two overlays sharpen the story:
- Context overlay — roads, water bodies, and towns at low opacity
- Reference Labels — place names that orient a reader instantly